Scale & profiles
Zerops automatically scales your PostgreSQL service based on actual database usage. When your database needs more power, resources increase. When demand drops, resources scale down to reduce costs.
For complete scaling details across all services, see Automatic Scaling and High Availability.
How PostgreSQL scaling works
PostgreSQL services use vertical scaling to adjust CPU, RAM, and disk resources within containers based on usage patterns. Unlike runtime services, PostgreSQL does not use horizontal scaling (adding/removing containers). Instead, PostgreSQL services use deployment modes for high availability.
When scaling changes the service's resources, Zerops regenerates the PostgreSQL configuration and applies it with an automatic reload. If the new values require it, the service is restarted instead: rolling through the cluster in HA mode, a short outage in single mode.
A restart is only needed when the granted RAM crosses a memory step: 256 MiB, 512 MiB, 1 GiB, 2 GiB, 4 GiB, then multiples of 8 GiB. Scaling within a step reloads only; to rule out restarts entirely, keep minRam and maxRam within one step.
Scaling profiles
A scaling profile is the starting point for a PostgreSQL service. Each profile sets two things at once:
- The autoscaling envelope: the default minimum/maximum CPU, RAM, and disk, plus the free-resource headroom that controls how eagerly the autoscaler reacts.
- The PostgreSQL configuration: memory, WAL, planner, autovacuum, and replication settings tuned for a specific workload shape.
A profile name combines a workload type with a tier, e.g. oltp-production.
Workload types
| Type | Tuned for | Notes |
|---|---|---|
| OLTP | Transactional workloads like web apps, APIs, order processing, and auth. Short transactions and point lookups. | The default and most general-purpose type. Synchronous replication in HA. |
| OLAP | Analytical workloads like reporting, dashboards, and large aggregations. | Larger sort/hash memory, aggressive query parallelism, higher-resolution planner statistics. Asynchronous replication in HA (synchronous commits would throttle bulk loads). |
| WriteHeavy | High-volume ingestion like IoT telemetry, event logging, and metrics. | Commit batching, WAL compression, and aggressive autovacuum to keep up with write volume. Synchronous replication in HA. |
Available profiles
The tier part of the name sets the size of the autoscaling envelope (and, in HA, the replication topology). Which profiles you can pick depends on the deployment mode:
| Profile | Mode | Use it for |
|---|---|---|
oltp-hobby | Single | Side projects, prototypes, learning. Runs hot with minimal headroom to keep costs low. |
oltp-staging | Single / HA | Staging, internal tools, early-stage apps. Moderate headroom. Default for single. |
oltp-production | Single / HA | Business-critical transactional workloads. Generous headroom for traffic spikes. Default for HA. |
oltp-enterprise | HA only | High-throughput OLTP at scale. Highest connection limits and the most aggressive headroom. |
olap-production | Single / HA | Analytical / warehouse workloads. |
writeheavy-production | Single / HA | Ingestion pipelines and write-heavy workloads. |
custom | Single / HA | OLTP-based profile that lets you override individual PostgreSQL settings. See Custom profile. |
In HA mode the OLTP and WriteHeavy profiles run with two synchronous standbys, so an acknowledged COMMIT survives a node failure. OLAP runs with asynchronous standbys, trading a small potential window of recent writes for ingest speed.
Setting a profile
Set the profile when you create the service in the GUI, or with the profile field in your import YAML:
If you don't set one, the default is used (oltp-staging for single, oltp-production for HA). The profile can be changed at any time in the GUI.
Overriding the autoscaling envelope
The resource limits a profile sets are defaults. You can override any of them (CPU mode, min/max CPU/RAM/disk, and the free-resource thresholds) without switching to the custom profile, using the verticalAutoscaling block in your import YAML or the Automatic scaling configuration in the GUI. These overrides apply on top of any profile.
Custom profile
The custom profile uses the OLTP tuning as its base and additionally lets you override individual PostgreSQL configuration values through profileOverrides:
Settings that Zerops derives from the container's resources or that are required for the managed cluster to operate (shared_buffers, max_connections, JIT on/off, the pooler limits, and the replication/Patroni settings) are managed automatically and cannot be overridden.
Refer to the PostgreSQL configuration documentation for the meaning and valid range of each parameter, but mind the units: override values are plain numbers, with memory/disk sizes given in bytes and durations in nanoseconds. This differs from PostgreSQL's own conventions (kB, milliseconds, seconds). The table below shows which unit each key takes.
| Key | Type / unit | Description |
|---|---|---|
work_mem | bytes | Memory per sort/hash operation before spilling to disk |
hash_mem_multiplier | integer | Multiplier applied to work_mem for hash-based operations |
maintenance_work_mem | bytes | Memory for maintenance operations (VACUUM, CREATE INDEX, REINDEX) |
autovacuum_work_mem | bytes | Memory used by each autovacuum worker |
temp_buffers | bytes | Per-session memory for accessing temporary tables |
temp_file_limit | bytes | Maximum total disk space a session may use for temporary files |
effective_cache_size | bytes | Planner's assumption of total cache available (shared_buffers + OS cache) |
effective_io_concurrency | integer | Estimated number of concurrent disk I/O operations the storage can handle |
maintenance_io_concurrency | integer | Concurrent disk I/O operations for maintenance (VACUUM, prefetch) |
random_page_cost | number | Planner's estimated cost of a non-sequential page fetch |
default_statistics_target | integer | Default number of samples used by ANALYZE for column statistics |
jit_above_cost | number | Query plan cost above which JIT compilation is considered |
max_worker_processes | integer | Maximum number of background worker processes |
max_parallel_workers | integer | Maximum parallel workers that can be active at one time cluster-wide |
max_parallel_workers_per_gather | integer | Maximum parallel workers a single Gather node can start |
max_parallel_maintenance_workers | integer | Maximum parallel workers for maintenance (CREATE INDEX, VACUUM) |
wal_compression | string | Compression algorithm for full-page WAL images (off/pglz/lz4/zstd) |
wal_buffers | bytes | Shared memory used to buffer WAL data not yet written to disk |
wal_writer_delay | nanoseconds | Interval at which the WAL writer flushes WAL to disk |
wal_writer_flush_after | bytes | WAL bytes written before the WAL writer triggers a flush |
commit_delay | nanoseconds | Artificial delay before a WAL flush during commit to batch concurrent commits |
commit_siblings | integer | Minimum number of concurrent open transactions required for commit_delay to apply |
max_wal_size | bytes | Soft upper limit on WAL size that triggers a checkpoint |
min_wal_size | bytes | Minimum WAL size kept for future reuse before recycling segments |
autovacuum_max_workers | integer | Maximum autovacuum worker processes running concurrently |
autovacuum_naptime | nanoseconds | Delay between autovacuum runs on any given database |
autovacuum_vacuum_scale_factor | number | Fraction of table size added to the autovacuum threshold |
autovacuum_analyze_scale_factor | number | Fraction of table size added to the auto-analyze threshold |
autovacuum_vacuum_cost_delay | nanoseconds | Cost-based delay inserted by autovacuum between I/O operations |
autovacuum_vacuum_cost_limit | integer | Accumulated vacuum cost at which an autovacuum worker sleeps |
vacuum_cost_delay | nanoseconds | Cost-based delay inserted by manual VACUUM between I/O operations (0 disables) |
idle_in_transaction_session_timeout | nanoseconds | Terminate sessions that stay idle in a transaction longer than this |
Configure scaling
You can configure scaling settings:
- During service creation - Set initial scaling parameters when creating your PostgreSQL service
- During import - Define scaling configuration in your YAML import file using
verticalAutoscalingparameters - After service creation - Navigate to your PostgreSQL service and select Automatic scaling configuration to modify settings
Basic settings
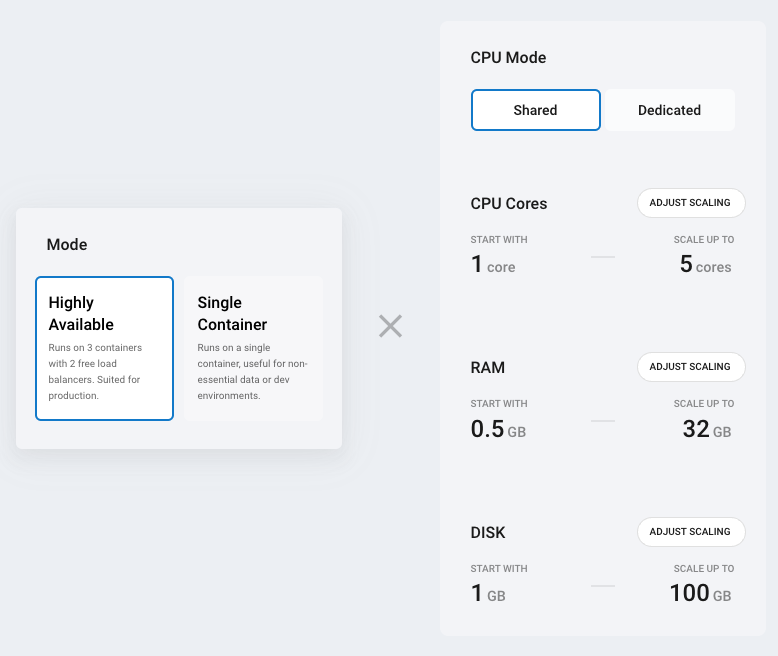
CPU Mode: Choose between shared (cost-effective, variable performance) or dedicated (consistent performance, higher cost). You can change CPU mode once per hour. See pricing for costs.
Resource limits: Configure minimum and maximum resources for your PostgreSQL service:
| Minimum | Maximum | |
|---|---|---|
| CPU cores | 1 | 8 |
| RAM | 0.25 GB | 48 GB |
| Disk | 1 GB | 250 GB |
- Lower the maximum to control costs and prevent over-scaling
- Raise the minimum when you need guaranteed baseline performance
- Set minimum = maximum to disable automatic scaling for that specific resource
Deployment mode (single container vs. highly available) is chosen when the service is created and cannot be changed later. See Deployment modes.
High availability
In HA mode, Zerops runs a 3-node cluster across separate physical machines, fronted by two database proxy containers (free of charge) that route traffic. When a container fails, Zerops automatically replaces it on a different machine and synchronizes data from the healthy copies.
A dedicated read-replica port (5433) lets you route read-only queries to the replicas, taking load off the primary and improving throughput. See Connection parameters and Connection ports and TLS.
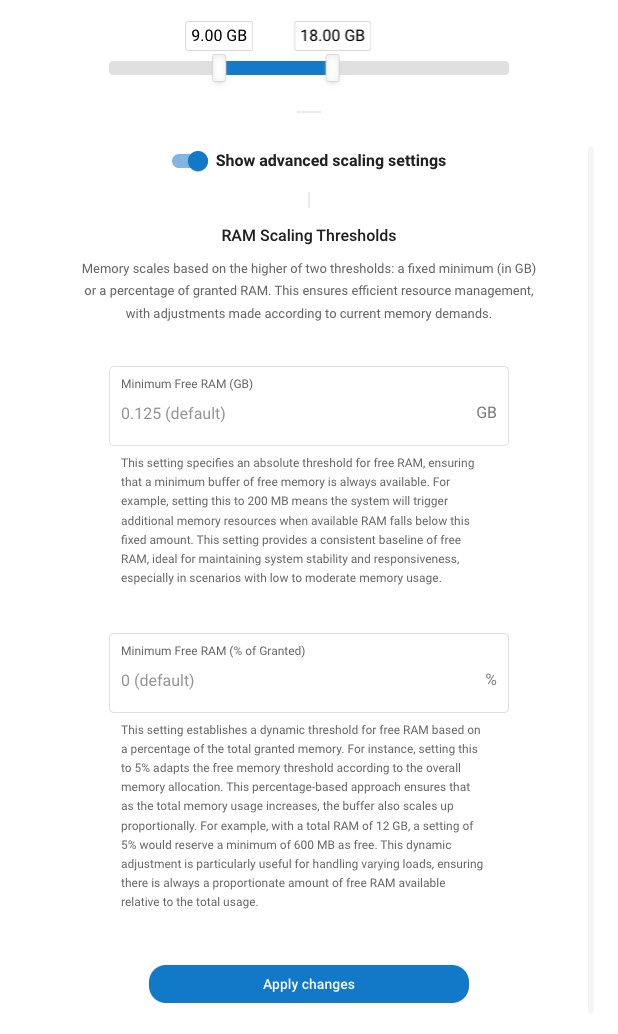
Advanced settings
Start CPU cores: Determines how many CPU cores are allocated during database startup. Increase this value if your PostgreSQL service starts slowly or requires more processing power during initialization.
RAM thresholds: Help prevent out-of-memory crashes by maintaining buffer space:
- Absolute (GB): Maintains this amount of free RAM at all times
- Percentage: Keeps this percentage of total RAM free
Consider increasing these values if your database experiences memory-related issues.
For detailed technical parameters and scaling behavior, see Automatic Scaling and High Availability.
Monitor usage
Navigate to your PostgreSQL service and select Service containers & Overview to view:
- CPU, RAM, and disk usage over time
- Historical scaling events
- Container health status
Technical details
Zerops monitors database usage and automatically adjusts resources based on predefined thresholds and timing parameters. The scaling behavior follows the same principles as other services on the platform.
For complete technical specifications including:
- Resource monitoring intervals and thresholds
- Scale-up and scale-down timing parameters
- Scaling increments and steps
- Detailed scaling behavior patterns
See Resource Scaling Behavior in the general scaling documentation.
Common issues
Out of memory errors
- Increase minimum free RAM settings in your scaling configuration
- Consider raising the minimum RAM allocation
- Check for memory-intensive queries or operations
Higher than expected costs
- Consider lowering your maximum resource limits
- Review scaling patterns in the monitoring dashboard
Slow database startup
- Increase the "Start CPU cores" setting
- Consider switching to dedicated CPU mode for consistent performance
Not utilizing HA mode effectively
- Use port
5432for write operations (INSERT, UPDATE, DELETE) - Use port
5433for read operations (SELECT) to distribute load across replicas - See Connection Parameters for details
Need help? Join our Discord community for assistance!